

Summary Points
Xavier rapidly intensified to Category 5, strongest November east of the date line.
El Niño’s warm waters and favorable conditions fueled its unusual northeastern formation.
Xavier damaged Cook Islands homes, disrupted power, then weakened as it moved westward.
Forecasts expect 11–15 regional cyclones, with eastern areas facing greatest risk.
The Stormy Southwest Pacific
Xavier strengthens in El Niño-warmed waters
As the unusually quiet 2026 North Atlantic storm season began to wind down, activity picked up across the Southwest Pacific. On Nov. 15, the Fiji Meteorological Service began issuing updates about a slow-moving tropical disturbance northeast of Samoa and the Cook Islands. Within days, the system had become one of the region’s strongest November cyclones in decades.
Named Xavier, the storm intensified rapidly. It formed where wind shear was weak and sea surface temperatures reached about 29 degrees Celsius (84 degrees Fahrenheit). Warm water provides energy for tropical cyclones, while low wind shear allows a storm’s circulation to organize. Together, those conditions helped Xavier strengthen.
NASA satellite observations showed the cyclone moving along the southwestern edge of a broad band of unusually warm water stretching from South America into the central Pacific. The warm band was a sign of El Niño, which had been present in the region since June. Research indicates that El Niño can shift Southwest Pacific storm activity northeast and support rapid intensification. Xavier’s formation east of the international date line was consistent with that pattern, though a single storm cannot establish a seasonal trend.
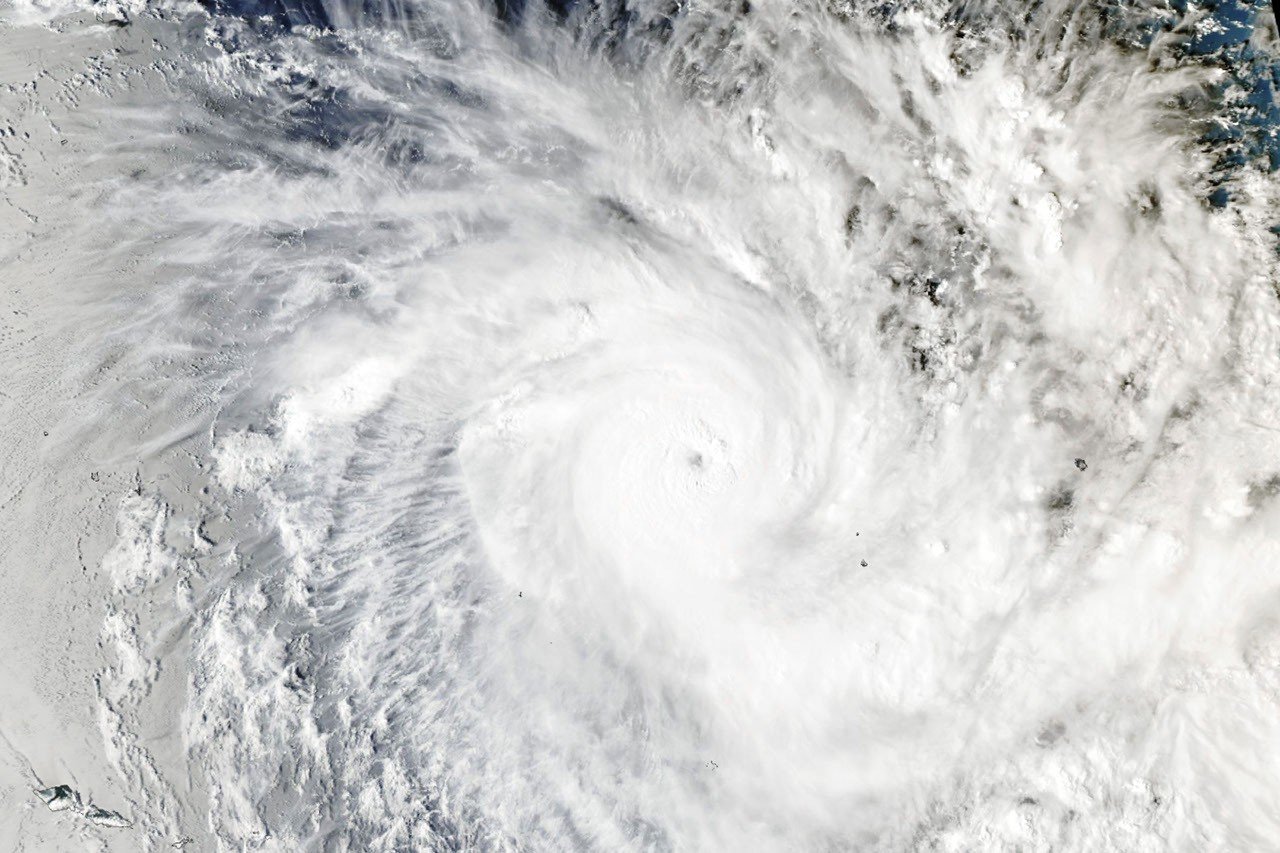
The Fiji Meteorological Service had named only one other storm in the basin that season: Wati, a short-lived cyclone that formed in October. Xavier quickly became far more powerful. At its peak on Nov. 17, its winds reached about 220 kilometers per hour (140 miles per hour). That made it a Category 5 storm on the regional scale and a Category 4 on the Saffir-Simpson scale used in the United States. It was also the strongest November cyclone on record east of the international date line, according to storm researchers.
Xavier damaged homes and disrupted power as it passed near the northern Cook Islands, according to news reports. Later, dry air and stronger wind shear weakened the storm as it moved west. That change reduced the threat to Samoa and American Samoa, but it did not erase the difficulties faced by affected communities. Power outages can also strain access to food and other essentials.
Satellites track a changing storm season
NASA’s Aqua satellite captured Xavier at 02:53 Universal Time on Nov. 17, equivalent to 4:53 p.m. Cook Islands time on Nov. 16. The image came from MODIS, the Moderate Resolution Imaging Spectroradiometer. At the time, forecasters estimated Xavier’s maximum winds at about 195 kilometers per hour (120 miles per hour). The storm strengthened further later that day.
Satellite imagery gives forecasters a broad, timely view of storms over remote ocean areas, where direct observations are scarce. Instruments such as MODIS can show cloud patterns and storm structure, while other data help track changes in wind and ocean conditions. These observations support forecasting, but they do not remove uncertainty. Storms can change quickly, and local impacts depend on a system’s path, strength and interaction with land. Forecasts and ground-based reports remain essential.
The season may bring more storms. The Fiji Meteorological Service outlook calls for 11 to 15 named tropical cyclones in the Southwest Pacific, with the greatest risk east of the date line. The basin’s storm activity typically peaks in February.
For island communities, early warnings can help officials prepare shelters, protect infrastructure and plan for disruptions. But forecasts have practical limits: warnings must reach people in time, and residents need safe places and supplies to act on them. As the season continues, satellite monitoring and local preparedness will both matter.
Stay Ahead with the Latest Tech Trends
Explore the future of technology with our detailed insights on Artificial Intelligence.
Explore past and present digital transformations on the Internet Archive.
Space
